T.V. ratings measure the size and composition of a television audience. They are the primary means by which broadcasters, advertisers, and networks gauge program success. The rating system can provide invaluable information about a show’s performance, programming, and marketing decisions.
T.V. ratings represent the percentage of a given group of people watching T.V. at that time and tuning into a given program. The idea is to estimate a total audience for a specific period.
Rating systems work by collecting data from panels of households across the nation. Viewers submit information about their T.V. viewing habits as part of their participation in these panels. Companies such as Nielsen Media Research then collect and analyze this data to determine program ratings.


What does H.H. mean in T.V. ratings?
H.H. represents “Households” in T.V. audience measurement, and” it is often cited as the last word in measuring success. In the report, we can see impressions, ratings, reach, and minutes—all segmented by any number of demographic groups.
The primary metric used to assess a program’s success is the household rating (HHR). This number reflects the percentage of households tuned into a particular program during its timeslot, typically expressed as a fraction or percent. For example, if 9% of all households in the U.S. watched “The Game Of Thrones” on Thursday” at 8 p.m., we could” say that “The Game Of Thrones” had an HHR of 9%.
Another important metric used in T.V. ratings is average viewership (A.V.), which measures the number of people watching any program across all households tuned into it during its timeslot. Average viewership estimates how many people watched an individual episode (e.g., 8 million) and how many people watched multiple episodes over time (e.g., 20 million total over five weeks). It also allows us to compare programs more accurately since it considers how often each episode was viewed (as opposed to just one viewing per household).
In addition to HHR and A.V., other metrics can be used to assess viewership trends: share, demographic statistics, reach, frequency-of-viewing numbers, etc. Share measures what percentage of viewers in a particular market or area tuned into any given show; demographic stats report age or gender-specific viewership; reach tells us how many unique viewers watched at least some portion of a program; frequency-of-viewing numbers indicate how often viewers with different levels of interest in a show watch it; and so on.
Overall, TV rating systems provide valuable insights about who watches television programs and why they watch them. These insights allow media professionals to make effective decisions about what shows to keep on air and which ones should promptly be discarded from their lineups. By taking advantage of this data source and analyzing it effectively, industry leaders can ensure that only quality shows get broadcast while minimizing financial losses resulting from low viewership numbers.
The techniques of estimating viewership generally vary from region to region. However, the conventional system of evaluating television viewership patterns is a standard rating method. Like the USA, most countries deploy The Nielsen Company’s services to keep tabs on the population’s TV-watching population.
What are T.V. ratings based on?
T.V. ratings are based on measuring using an in-house apparatus to estimate the number of people watching a specific television show. For example, the Nielsen ratings are calculated based on a sample of 39,000 homes and about 100,000 people who are demographically representative of the population.
T.V. ratings, also known as television audience measurement, are utilized to quantify the size and composition of an audience viewing a particular television program. As such, the ratings provide the understanding needed to make critical decisions related to broadcasting and advertising. The main components of T.V. ratings include estimates of the number of people watching a specific television show. This is accomplished by using an in-house apparatus that measures viewership by collecting data from samples representing the population as a whole.
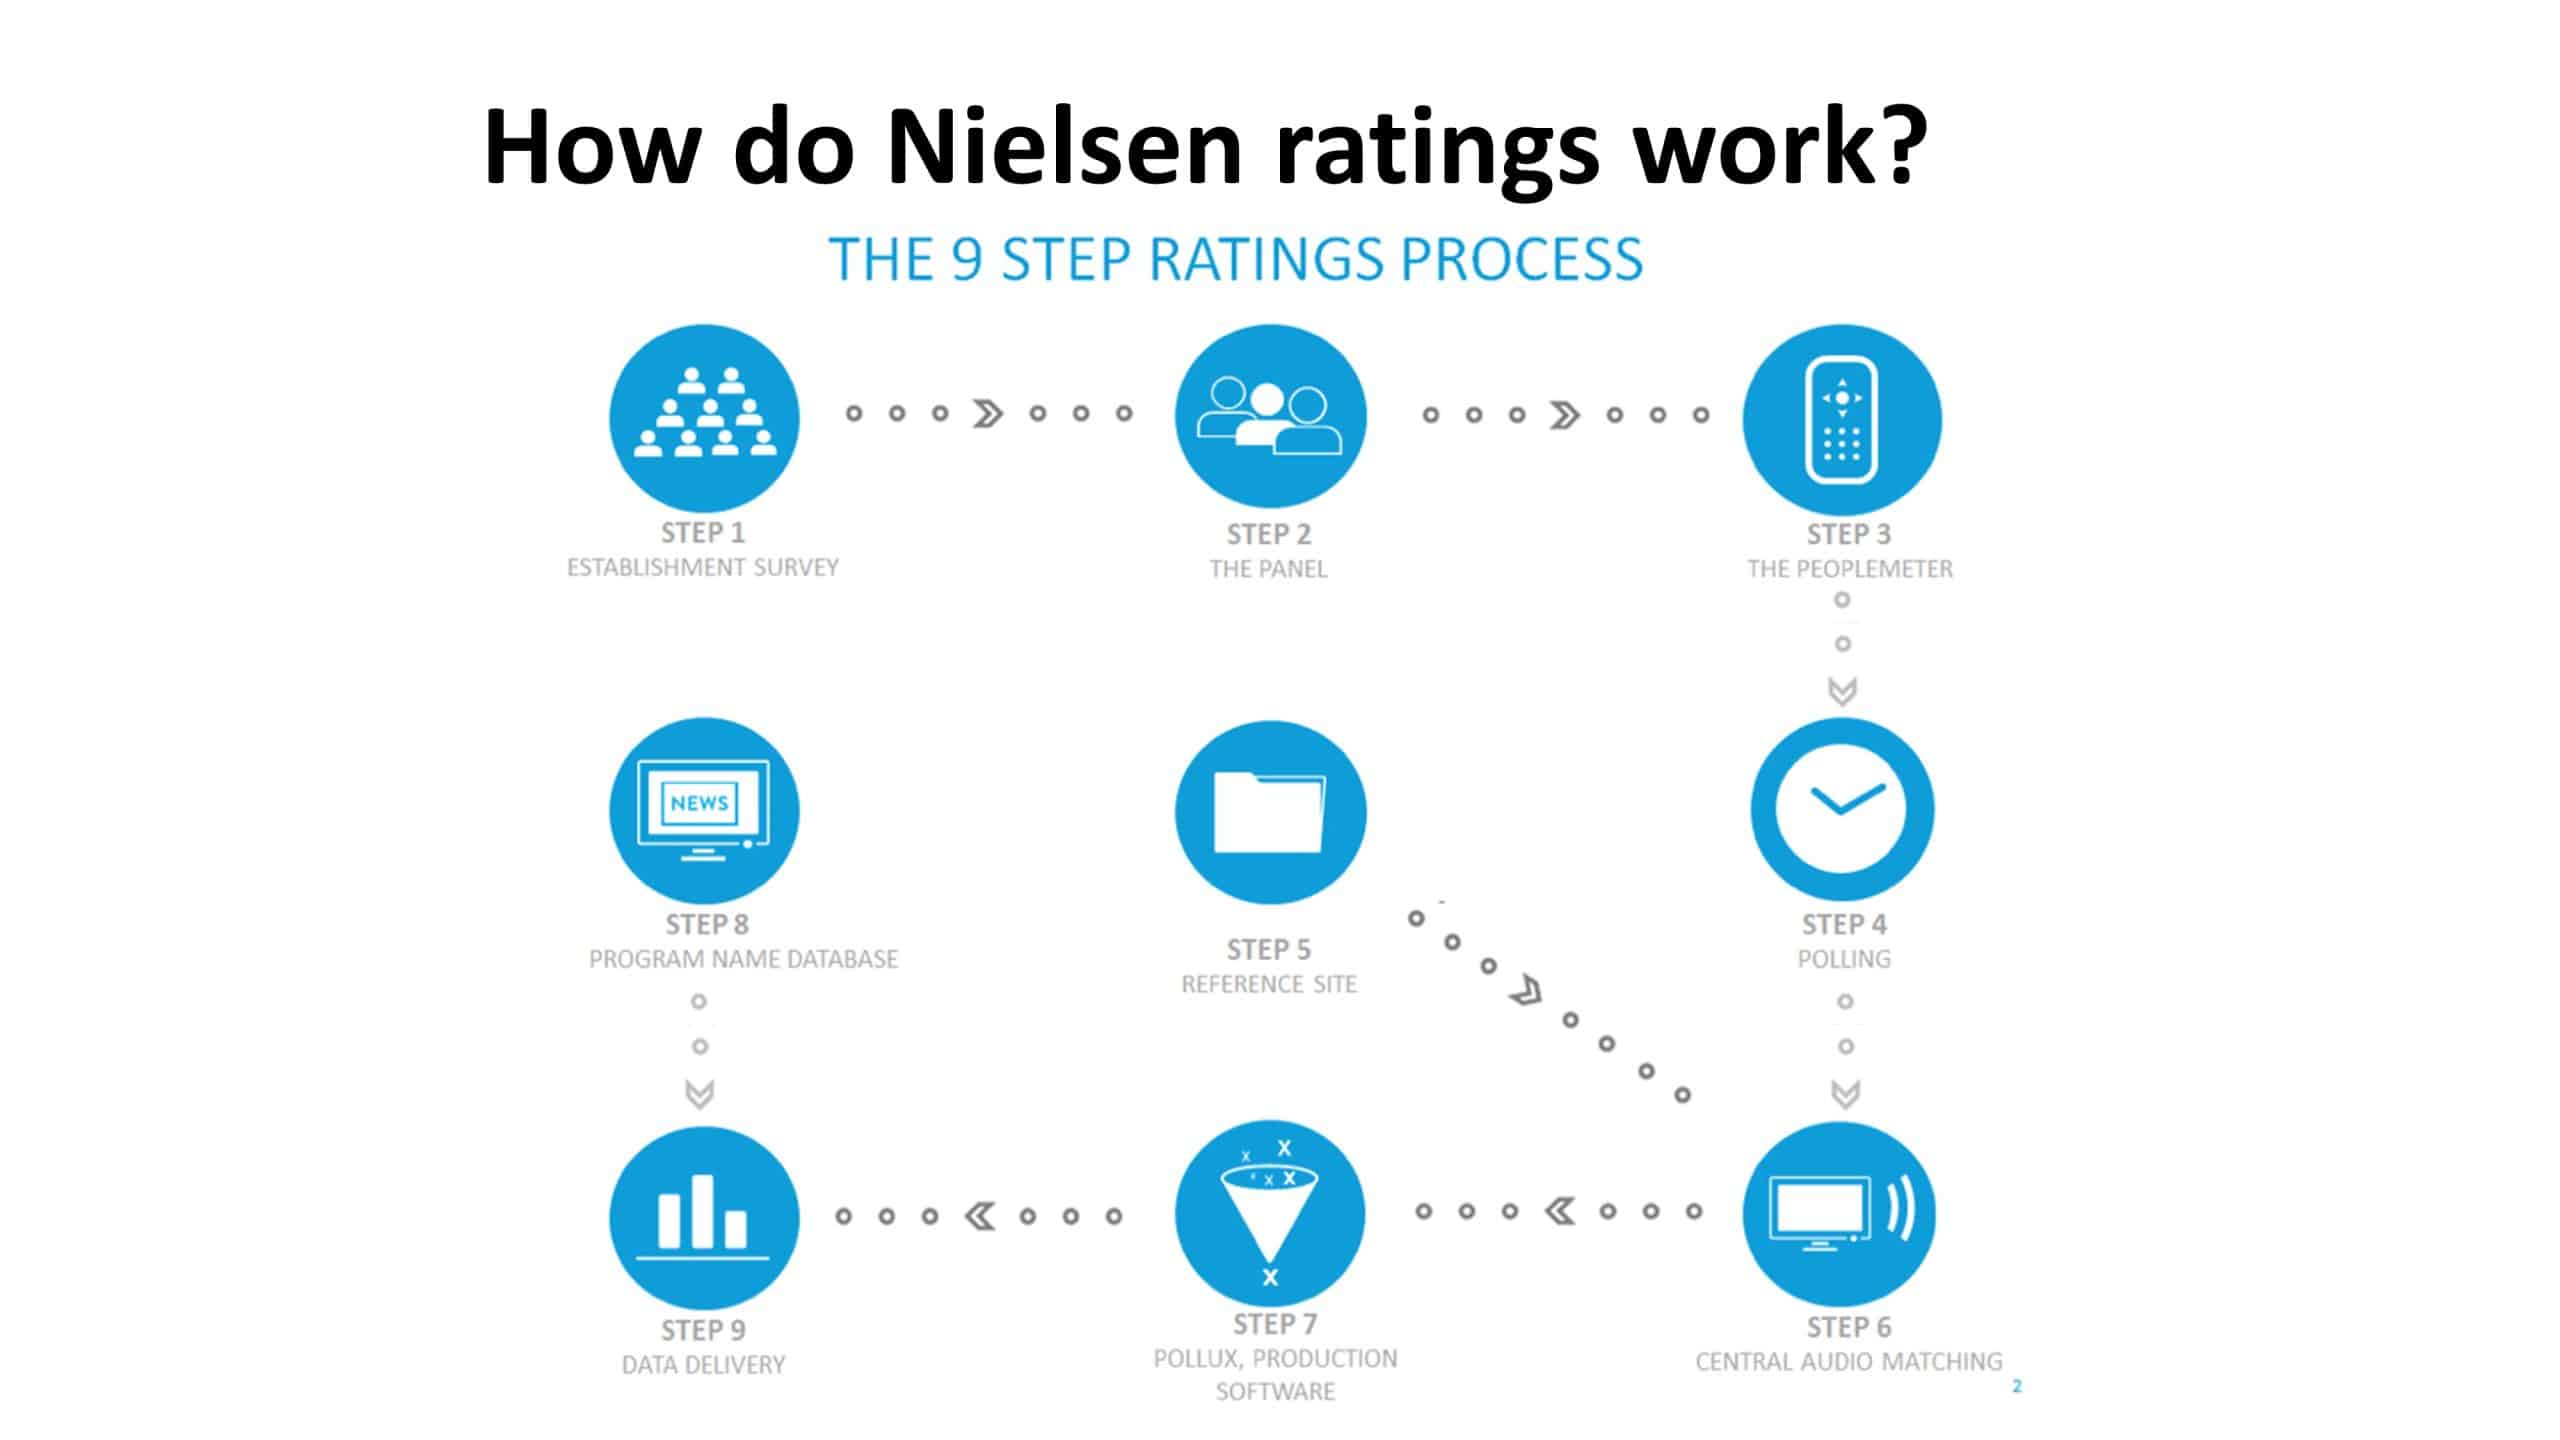
How do Nielsen ratings work?
Nielsen utilizes an in-house apparatus to estimate the number of people watching a specific television show. These numbers reveal the average count of thousands of people belonging to a particular gender and age, which also shows the number of viewers. This kind of data is then used to assess the popularity of a T.V. program. Accordingly, the networks calculate the advertising fees they must charge the respective companies.

The Nielsen Rating system collects data from these households about what programs are being watched at any given time and for how long. This information is then combined with other market survey results to generate national estimates that can be used to identify trends in viewership behavior.
In addition to providing information about how many people watch a program at a given time, T.V. ratings can help advertisers decide which shows best suit their campaigns. This includes analyzing factors such as which demographic groups are more likely to watch a particular program or which programs have higher audience retention rates over time. By looking at this data, companies can target their commercials more effectively and allocate their advertising budget accordingly.
During the time sweep periods, Nielsen viewers manually monitor the particular sets of shows they regularly watch.
How are T.V. ratings determined?
- Firstly, sampling data is collected by a survey panel from Nielsen Media Research. This panel consists of individuals from all over the United States and is representative of the demographics of viewers in the country.
- The data gathered from this sample helps to determine the percentage of households tuned into a particular show. As such, it indicates how many people watch the program and their age, gender, and ethnicity breakdown.
- Nielsen also measures the average Household Rating for each show, indicating the percentage of T.V. households watching at any given time or during an entire broadcast period (often expressed as H.H.: mm).
- Furthermore, Nielsen also generates rating points that measure how popular a show is among those viewers sampled who are part of its target audience. For example, if a show is aimed at people aged 16-34, the rating point score would be based on that demographic’s viewership patterndemograpattern demographic’s-hold viewership patterns.
- Finally, after compiling all this data, Nielsen creates a report that reveals how many people watched each program and their composition in terms of age/gender/ethnicity and other factors that may influence viewing habits and preferences. Broadcasters can then use this report to assess the success or failure of their shows based on these numbers and decide whether to continue airing them in future seasons or cancel them altogether due to lackluster performance compared to other programs within its target market segmentation.
Given below is an overview of the procedure followed by the Nielsen Company to estimate television viewership:
- Data Collection through T.V. Box
When someone in a Nielson-recorded household switches on the T.V., that person reveals their identity while the box keeps a tab on the period of viewing a specific program. Every family member’s viewing pattern is monitored individually at a given time. If a group of people is watching a show, they input their related data (gender and age) into the box. This way, the viewer-specific information is collected by Nielsen’s box compared to the geNielsen’sa gathered by a typical cable T.V.
This in-house equipment lets the Nielsen Company evaluate T.V. viewership every single day.
- Viewers Sampling
After collecting the viewers’ sample, Nielsen converts viewership into a percentage. This percentage signifies the total viewership of a specific T.V. show. For instance, if 2500 persons in Nielsen households watch an Example News Show weekly, the company estimates that the show has an overall viewership of 10% in these households. Since the networks rate their shows based on the number of weekly viewers, 10 points are assigned to Example News Show.
- Demographics & Commercial Ratings of TV Shows
Besides the rating points, what is even more critical is a show’s demographics and commercial ratings. As the Nielsen box collects gender and age-related information, companies can use this data to target specific groups of people. For example, people in the 18-49 age group are more likely to purchase things than others. Hence, this demographic proves crucial to advertisers.
The networks also tend to charge a greater fee to advertisers who add commercials to shows popular among this age group. This applies equally to shows with lower ratings than the programs preferred by other age groups.
Besides, there is one secondary rating set by The Nielsen Company. Known as ‘commercial rating,’ it relies on the view upon ‘pattern of Cialis. Commercial ratings disclose whether the people are watching the commercials or avoiding them by changing the channel and skimming through other shows. Most advertisers are more concerned about the commercial rating than the market shares or the general rating. This is because the people who do not watch commercial ads carry lesser significance for the advertisers than those who do.
Rating is vital for T.V. T.V. networks as it helps them decide the sale time allocated to advertisers.
- Sweeps Time Periods
‘Sweeps’ is a common term used for ratings. The periods of February, May, July, and November are called ‘sweeps’. This month, Nielsen provided viewership diaries to millions of family households. Viewers must manually note T.V. T.V. programs they watch and give the data to the Nielsen company.
During this time, T.V. networks frequently run appealing programs to enhance viewership and increase their points in people’s diaries.
- Time-Flexible People’s & Intern T.V.
The rising use of DVRs (Digital Video Recorders) has complicated rating shows. With DVRs, people can record T.V. programs and view them later. This ‘time-shifted’ or ‘time-flexible’ viewing makes it difficult for Nielsen to monitor when people have watched a specific show. Nielsen ratings do consider the people who recorded a particular T.V. program. Still, they estimate the ratings based on the assumption that these potential viewers watched the show within three days of recording.
Further, most people have avoided commercial ads while viewing the program on DVR. So, the calculated ratings do not matter to the advertisers.
The growing accessibility of T.V. programs on the internet can help create new ways to monitor viewership. Now, the networks quickly get data on people purchasing and downloading a show via several websites. Some of these sites extend displays for free with minimal advertising. T.V. channels track the downloads and determine whether to keep running the show. As for the advertisers, this kind of viewership information is far less significant than the usual T.V. viewership. This has resulted in internet streams preferably being made for low-priced shows rather than conventional broadcasting.
What does D stands for in T.V. ratings?
T.V. audience measurement: “D” represents suggestive dialogue, usually about sex. The main goal of this letter, “D,” added to the base, is to let parents know that a show may contain suggestive dialogue.
In conclusion, T.V. ratings are invaluable tools for broadcasters and advertisers to make informed decisions about programming and campaigns. They allow them to measure viewership nationally and demographically while also providing insights into viewer behavior so they can tailor ads accordingly.


Learn more about authors in Nimblefreelancer's team biography page.
- 6 Proven Ways SaaS Founders Actually Get Customers (With Real Examples) - December 17, 2025
- Facebook Ads to Get Followers! - December 27, 2024
- ClickUp vs. Slack - December 20, 2024