A user usually expects a response time to be as fast as possible. However, a system’s response time may sometimes exceed the user’s expectations, leading to dissatisfaction. The Apdex score is designed to address this issue by providing an objective measure of user satisfaction in real-time.
What is the Apdex Score?
The Apdex score represents a measure that helps evaluate user satisfaction with the performance of a software application or service introduced by the Apdex Alliance. Apdex provides a simple way to understand how well an application meets user expectations.
The word “Apdex” is an acronym for the Application Performance Index. It is a ratio of satisfied user interactions to total user interactions, ranging from 0 to 1. The Apdex score is calculated based on a system’s response time. Response time is the time it takes for a system to respond to a user request. It can be anything from the time it takes for a user to click a button to the time it takes for a system to process complex data.


In simple terms, the Apdex score is like a report card that tells you how happy users are with the performance of a website, app, or any other software. It considers how quickly the application responds to user actions, such as loading a page or completing a task.
The score is usually between 0 and 1, with one being the highest and indicating perfect user satisfaction. A score of 0 means users are very dissatisfied with the application’s performance.
To calculate the Apdex score, you must define a threshold or time limit representing an acceptable user response time. If the application responds faster than the threshold, it’s considered satisfactory; if it takes longer, it’s frustrating.
The Apdex score is calculated by dividing the number of satisfactory user experiences by the total number of user experiences, considering the defined threshold. The resulting score helps developers and businesses understand how well their application meets user expectations and where improvements may be needed.
Concept and Calculation of Apdex Score
Apdex uses a three-zone model to calculate user satisfaction:
- Satisfied: The application response time is within the expected limits. In addition, the users are happy and don’t experience any lag.
- Tolerating: The response time is more than expected but acceptable. The user notices the lag but continues to use the application.
- Frustrated: The response time is unacceptable, leading to unhappy users.
An Apdex score is calculated using a predefined threshold (T) based on these three zones. The threshold represents the time value below which users are expected to be satisfied. It’s worth noting that the choice of T is subjective and varies depending on the nature of the application and user expectations.
The formula to calculate the Apdex score is:
Apdex Score = (Satisfied Requests + Tolerated Requests / 2) / Total Requests
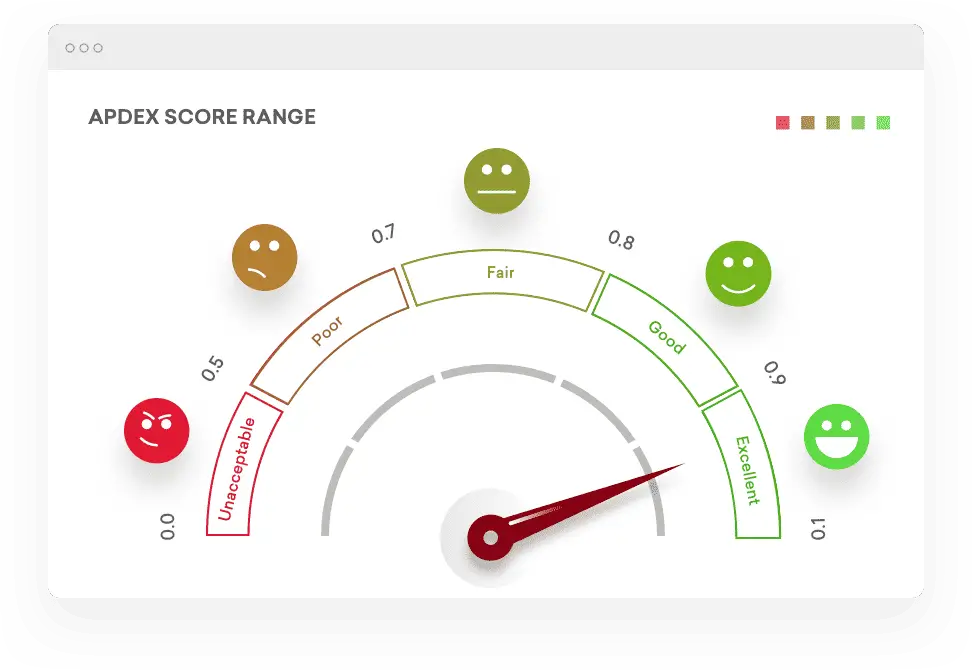
The output is between 0 and 1, where 0 represents all frustrated users, and 1 represents satisfied users. Scores are generally classified as follows:
- Excellent: 1.00-0.94
- Good: 0.93-0.85
- Fair: 0.84-0.70
- Poor: 0.69-0.50
- Unacceptable: Below 0.50
Apdex Score Calculation Practical Example
Let’s assume we have an e-commerce website and want to calculate the Apdex score based on the response times of user interactions. For this example, let’s consider the following response time thresholds:
- Satisfied (S): Response time <= 2 seconds
- Tolerating (T): 2 seconds < Response time <= 8 seconds
- Frustrated (F): Response time > 8 seconds
Let’s assume we have collected response time data for 100 user interactions. Here’s a sample set of response times:
[1.5, 3.2, 4.8, 2.1, 9.5, 1.7, 5.6, 3.9, 7.2, 1.3, 2.4, 8.3, 6.9, 2.8, 4.1, 3.6, 1.9, 7.8, 2.5, 5.3, 9.9, 2.7, 1.6, 3.3, 5.9, 4.2, 2.6, 6.5, 3.1, 7.1, 1.8, 2.9, 4.5, 8.1, 3.8, 1.4, 6.7, 5.4, 2.3, 7.5, 8.7, 3.7, 4.6, 6.3, 5.1, 1.2, 9.3, 3.4, 7.6, 2.2, 4.9, 6.1, 5.7]
Now, let’s categorize these response times:

- Satisfied (S): Response time <= 2 seconds
- [1.5, 1.7, 1.3, 1.9, 1.6, 1.8, 1.4, 1.2]
- Tolerating (T): 2 seconds < Response time <= 8 seconds
- [3.2, 4.8, 2.1, 2.4, 2.8, 3.6, 2.5, 2.7, 2.6, 3.1, 3.8, 2.3, 3.3, 2.9, 3.7, 3.4, 2.2, 2.9, 2.2, 2.4, 2.5, 2.7, 2.6, 2.9, 2.3, 2.2, 2.9, 2.2]
- Frustrated (F): Response time > 8 seconds
- [9.5, 8.3, 9.9, 8.1, 7.8, 8.7, 7.5, 9.3, 7.6]
Now, let’s calculate the Apdex score:
- Number of satisfied responses (S): 8
- Number of tolerating responses (T): 27
- Number of frustrated responses (F): 9
Apdex = (S + (T/2)) / (S + T + F) = (8 + (27/2)) / (8 + 27 + 9) = (8 + 13.5) / 44 = 21.5 / 44 ≈ 0.4898
The calculated Apdex score is approximately 0.4898. Since we established that a good Apdex score is typically between 0.85 and 1.0, this particular score would not be considered reasonable. This case indicates that many users had a frustrating experience due to longer response times.
To achieve a good Apdex score, you need to optimize the application’s performance, reduce the number of frustrated responses, and increase the number of satisfied and tolerating responses. For example, this might involve identifying and resolving performance issues, optimizing code, improving server capacity, or employing caching mechanisms to reduce response times. By continuously monitoring and improving the Apdex score, you can ensure a better user experience and higher satisfaction with your application or service.
What is a good Apdex Score?
A good Apdex score typically ranges between 0.85 and 1.0, where 1.0 represents excellent user satisfaction. However, interpreting a “good” score can vary based on context and industry. For example, some organizations might consider a score above 0.9 excellent, while others may have different benchmarks.
Apdex (Application Performance Index) is a metric used to measure and evaluate user satisfaction with the performance of an application or service. It provides a numerical value representing the perceived quality of the user experience based on response time or latency. A good Apdex score indicates a high level of user satisfaction, while a lower score implies a lower level of satisfaction.
The Apdex score is typically calculated by measuring the ratio of satisfied, tolerating, and frustrated user responses to a particular application or service. The responses are categorized based on predefined threshold values for response time or latency, which are determined based on the specific requirements and expectations of the application or service.
Here’s how the Apdex score is calculated:
- Next, set the desired threshold value for response time, typically denoted as T.
- During the measurement period, record the response times of user interactions with the application or service.
- Categorize the response times into three groups:
- Satisfied (S): Response time <= T
- Tolerating (T): T < Response time <= 4T
- Frustrated (F): Response time > 4T
- Calculate the Apdex score using the formula: Apdex = (S + (T/2)) / (S + T + F)
In this formula, (T/2) is added to the number of satisfied users to account for the tolerating users who may still have a good experience.
The threshold value (T) used in Apdex calculations can significantly impact the score. For example, setting a higher threshold will categorize more user responses as satisfied, leading to a higher Apdex score. Conversely, a lower threshold may result in more responses categorized as frustrated, leading to a lower score. Therefore, it’s crucial to set appropriate thresholds that align with the application or service’s performance expectations and the end-users’ requirements.
Advantages of Apdex Score
- Simplicity: Apdex provides a simple, concise score that represents users’ satisfaction level. This score can be easily communicated across all levels of an organization.
- Standardization: It offers a standard measure that can be applied across different applications and services, thereby allowing performance comparison.
- User-centric: Apdex is focused on the user’s perception of application performance, not just the technical metrics, making it an effective tool for improving user experience.
- Guides performance improvement: Organizations can prioritize performance improvements to maximize their impact by identifying areas of low user satisfaction.
Limitations of Apdex Score
- Subjectivity: The definition of ‘satisfied,’ ‘tolerating,’ and ‘frustrated’ is subjective and depends on the specific threshold (T) chosen.
- Not all-inclusive: Apdex is based on response time and doesn’t consider other factors that can affect user experiences, like application functionality or design.
- Lacks detail: The simplicity of the Apdex score can also be a drawback as it fails to provide detailed insights into specific issues affecting application performance.
Conclusion
Apdex Score is an invaluable tool for businesses and organizations to measure and monitor user satisfaction with the performance of their web applications. It offers an easy-to-understand metric that can be used to improve user experience and application performance. However, it should be complemented with other performance metrics and indicators to provide a holistic understanding of application performance.


Learn more about authors in Nimblefreelancer's team biography page.
- 6 Proven Ways SaaS Founders Actually Get Customers (With Real Examples) - December 17, 2025
- Facebook Ads to Get Followers! - December 27, 2024
- ClickUp vs. Slack - December 20, 2024